
We know that user acquisition is tough. If you spend time running install ads, creating referral programs, and building sharing features for your app, you see many types of links to your app being shared and clicked. Unfortunately, you can’t get many insights from this data.
Click-to-install study
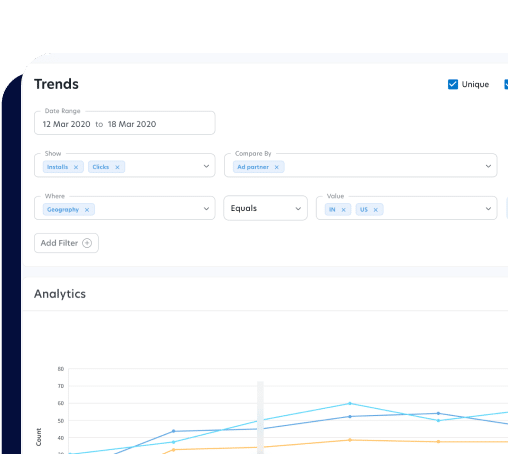
Which links drive installs? Which device types or channels convert the best? Today, Branch links power thousands of apps, over 300 million devices, and help thousands of developers close the loop on the click-to-install attribution. With this much info, we’re learning a ton about the mobile ecosystem that we’d like to share with you. To start, we’ve aggregated the data from 12 million different link clicks to show you which channels, platforms, and countries perform the best.
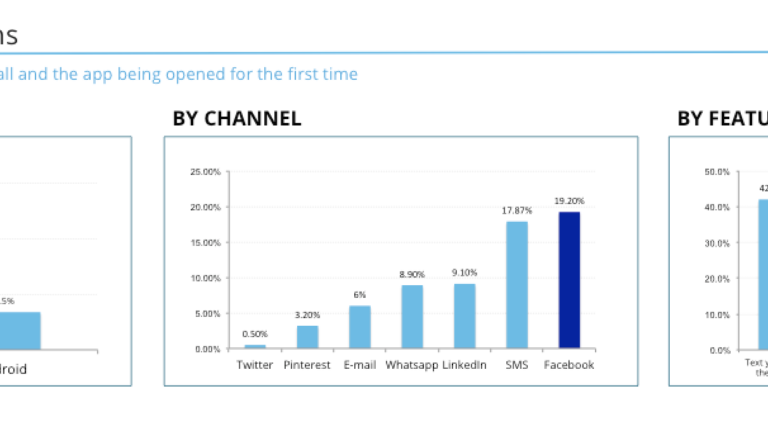
App click-to-install rates by device

Based on our data, click-to-install rates are slightly higher on Android than iOS. That’s probably due to download times: Android apps tend to be smaller, so they take less time to install. (Note: This data is for an attribution window of 30 minutes. Some solutions use week or month long windows between click and first open in order to reflect higher conversion rates).
App click-to-install rates by feature

Branch breaks down the “shared links” category into the following:
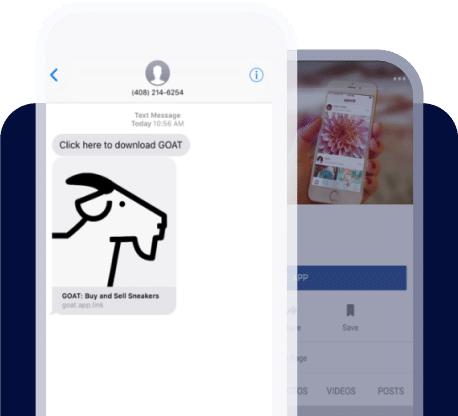
- Text-me-the-app links: From desktop, users enter their phone number to text themselves a link to download an app. Since Branch links default to this on desktop, we see a lot of these links. Given that users are sharing links with themselves, it figures that the conversion-to-install rate is high.
- Content sharing: Users share content with friends using deep links, bringing them directly to the content in the app. The numbers shown were counted before our release of Deepviews, an automated web preview of in-app content. In our beta tests, Deepviews increase the click-to-install conversion from 2x to 6x for content sharing.
-
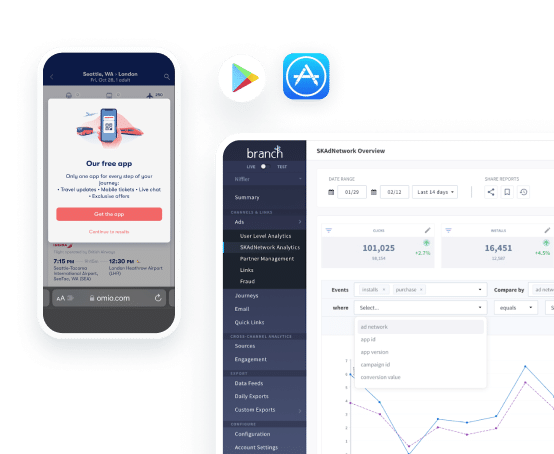
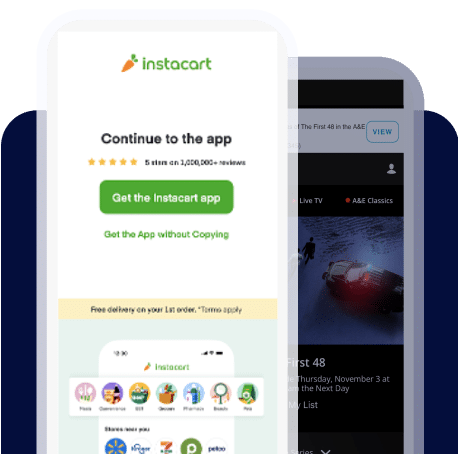
App banners: Users click an “Open in App” banner from a mobile website.
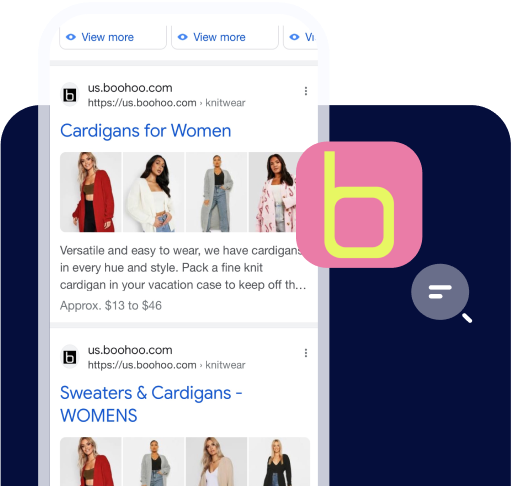
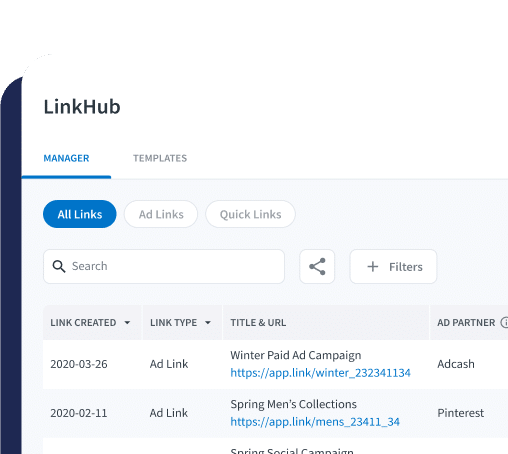
- Quick links: You can also create links in the Branch dashboard, using them to track conversion from ads, affiliate campaigns, or marketing emails. Their high conversion rate is likely a result of the context in which they are found; rich links shared in emails and on blogs. More context means more time to communicate an app’s potential.
- Referral links: As links that invite friends to try out new apps, these generally include a referral award. Despite the incentives, these have the lowest conversion rate because they come with the least context. But as we’ve seen before, incentives and referrals are not what drive app virality. The real driver is content and context.
App click-to-install rates by channel

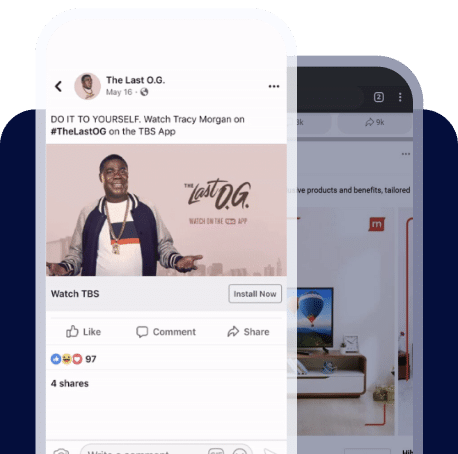
Channel-based comparisons are important for developers and marketer alike, so they can determine how to best allocate resources. The data doesn’t lie: Facebook and SMS convert the best. Facebook provides the most context while SMS is sure to keep users at the site of the install, on the device itself.
App click-to-install rates by country

Country by country, our study saw a strong correlation between conversion rate and network speed. The US lagged behind in both.
Click-to-open lag time by channel
Ever wonder how much time passes between a link click and the first app open? The answer: usually no more than five minutes, and almost never more than thirty. We were pleasantly surprised by these findings. We thought channels like Facebook and Pinterest would have a lower conversion-to-install in the first minute because their users are known to get distracted easily. What we found was the opposite. Facebook and Pinterest had the highest percentage of opens in the first minute of someone clicking a link.

Conclusion
All links are not created equal. As you can see by the data, click-to-install rates by feature seemed to have the most variance. Focusing on the right features can have a huge impact on how many people end up opening your app. In comparison, platform type had minimal impact on click-to-install rates.
Branch’s goal is to help you build the features and links that will allow you to grow your app. We know that data means everything to an app developer, so we wanted to share our knowledge with you. That’s why we’re excited about Deepviews, because our data shows they result in a significantly higher click-to-install rate compared to routing users directly to the app store. Best of all, if you’ve already integrated Branch, setting up Deepviews is as easy as clicking a button. Ready to get started? Click here to request a Branch demo.
Find something especially helpful from this data? Let us know below.
Special thanks to Kan Yu, our amazing data scientist who analyzed over 12 million link clicks to make this report possible.