

You’ve all heard the stories or know someone from your network who built a business primarily on virality. Virality is a challenging feature to build, optimize, and measure, especially since a lot of it can happen via channels that are impossible to measure effectively. For example, there are many cases where a referral can happen via word of mouth rather than a trackable digital event. That said, you still need to do the best you can to build, measure, and optimize this important channel, no matter the stage of your business.
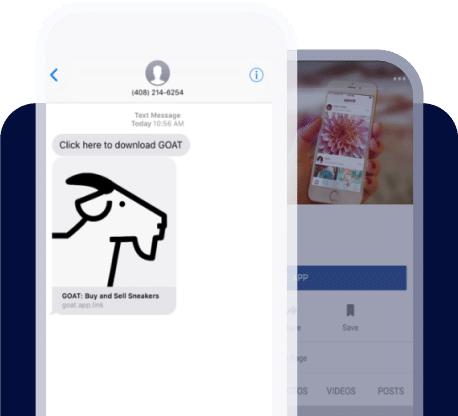
Branch offers the most robust linking platform that powers the vast majority of sharing and referral features in the market today. If you receive links from friends on your mobile device, most likely Branch is behind the scenes. Because of this, we have unparalleled insights into how these perform. We would never share the specific performance of any individual system, but we thought it’d be useful to prepare an overview of general statistics on the performance of various aspects of the viral funnel.
Before we dive in, let’s agree on some terminology. I’ve prepared an overview of the viral flow with various stages below. Let me define a few things so we’re on the same page.
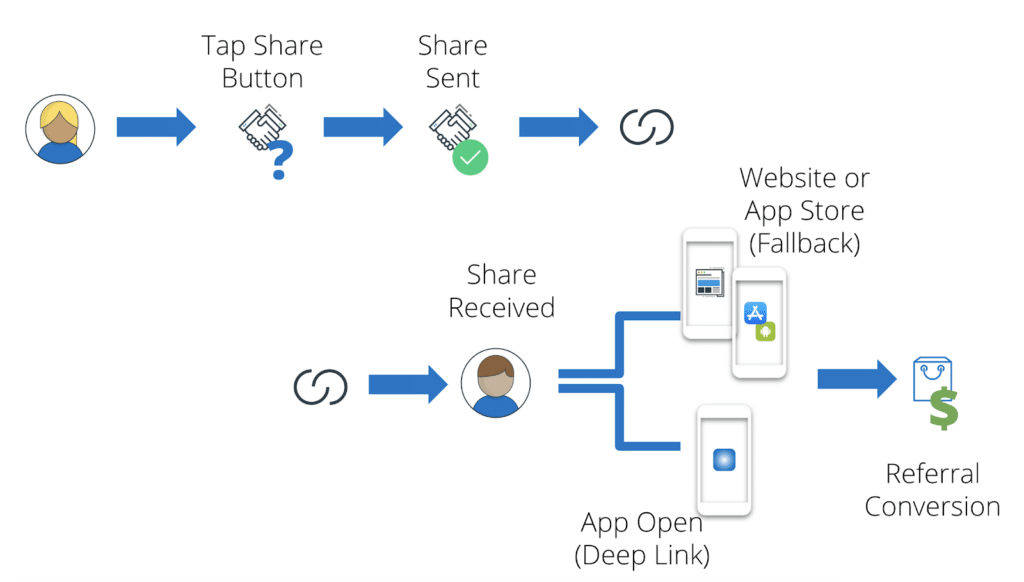
All referrals start with the original user who shares the link. As the referral funnel starts, you can see two important steps:
- First they tap the share button and are faced with the decision of who & how?
- After hopefully deciding on both of those things, they’ll successfully send the link out.
Then, you start the referred user funnel. This user may encounter the link on a number of different channels, and then start the simplified three-step funnel like so:
- Click on the received link.
- Be routed to the most appropriate platform (assuming you’re using good links like Branch).
- Convert (purchase or some other valuable event).
An Insight on Original User Sharing
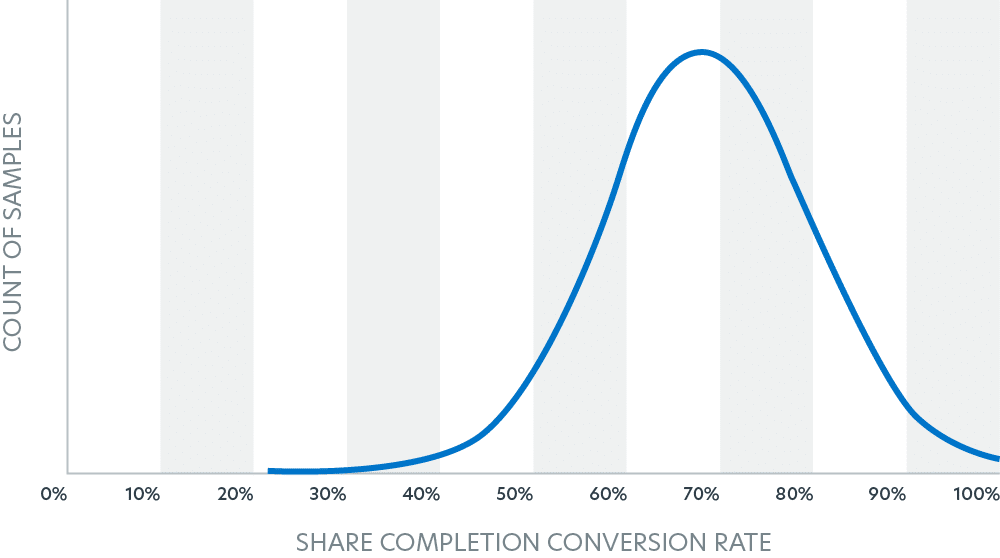
Let’s start by taking a look at the original user flow. We pulled aggregate data on the conversion rate from starting to share to actually sending the link. To be extremely clear on this rate, it’s the funnel between clicking on the “Share” button and actually sending a link to a user. You would expect this would be highly correlated with the motivation that the user has.
While looking at the histogram of conversion rates, we discovered there was actually a bi-modal distribution. You can see both buckets separated out in the chart below, labeled “High Converting Bucket” with an average conversion rate of ~70% and “Low Converting Bucket” with an average conversion rate of ~30%.
Histo. of Share Conversion Rates
(High Converting Bucket)
Hist. of Share Conversion Rates
(Lower Converting Bucket)
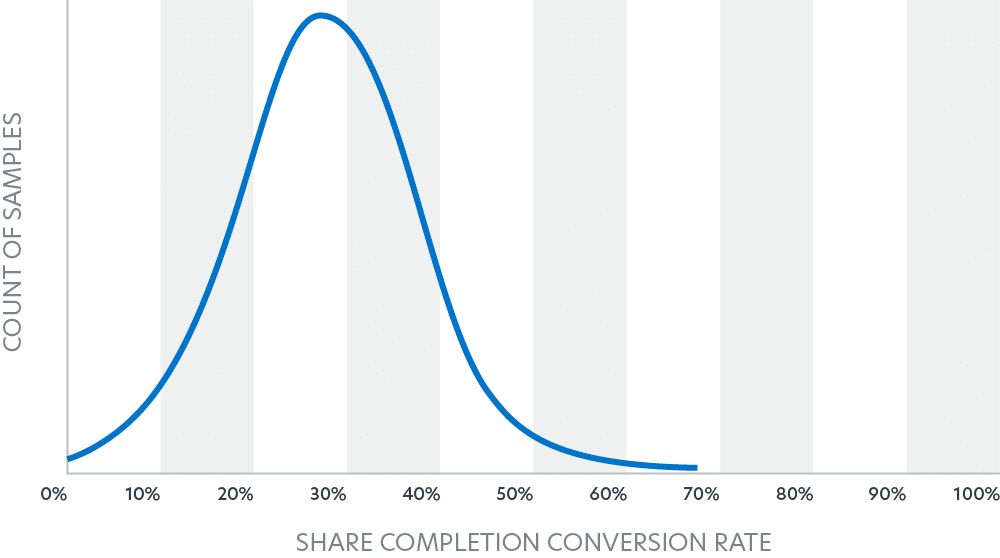
This was very interesting! We then looked at a few example programs in each bucket of the bi-modal, and the difference in user experience was clear. High converting share programs were typically using incentives to drive the share, whereas lower converting shares were your standard share feature. Out of respect for the example shown below, I’ve removed them from the data set.
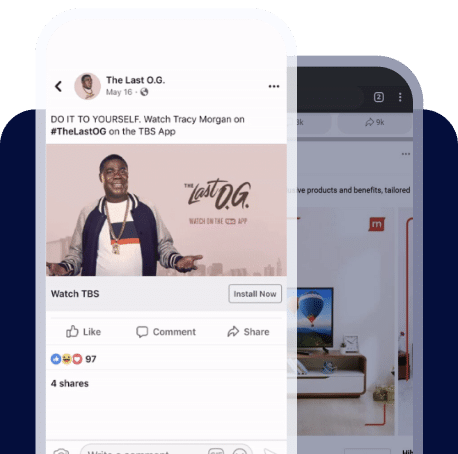
Incentives Drive Higher Conversions
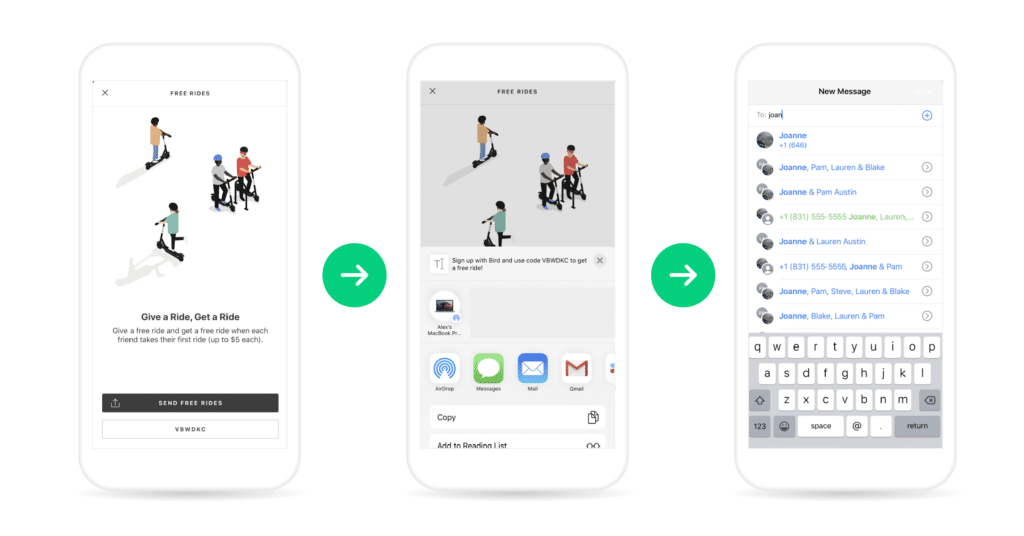
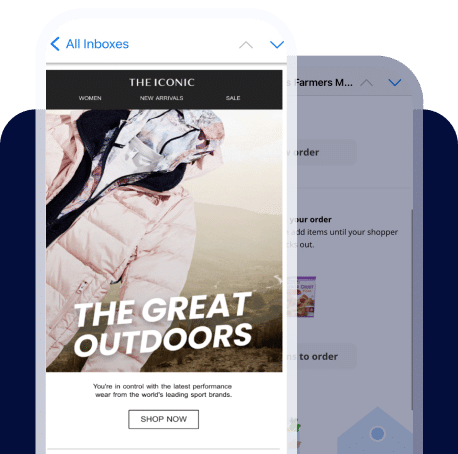
Above, you see the example flow from the Bird referral program. They offer double-sided incentives if you complete the share, as is common among high converting flows.
Standard Shares Convert Lower
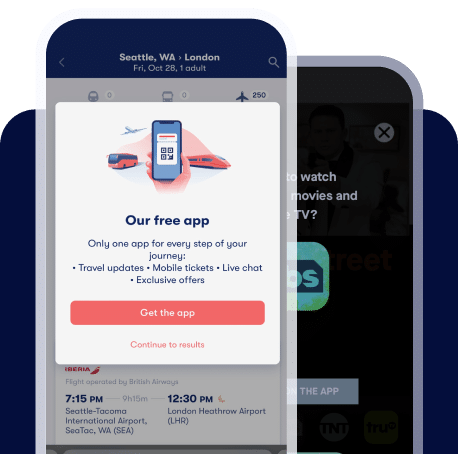
Above is an example of a non-incentivized referral program. These typically have higher abandon rates. If you take a look at your data, and find your users are abandoning shares, consider investing in some sort of incentives to drive the completion.
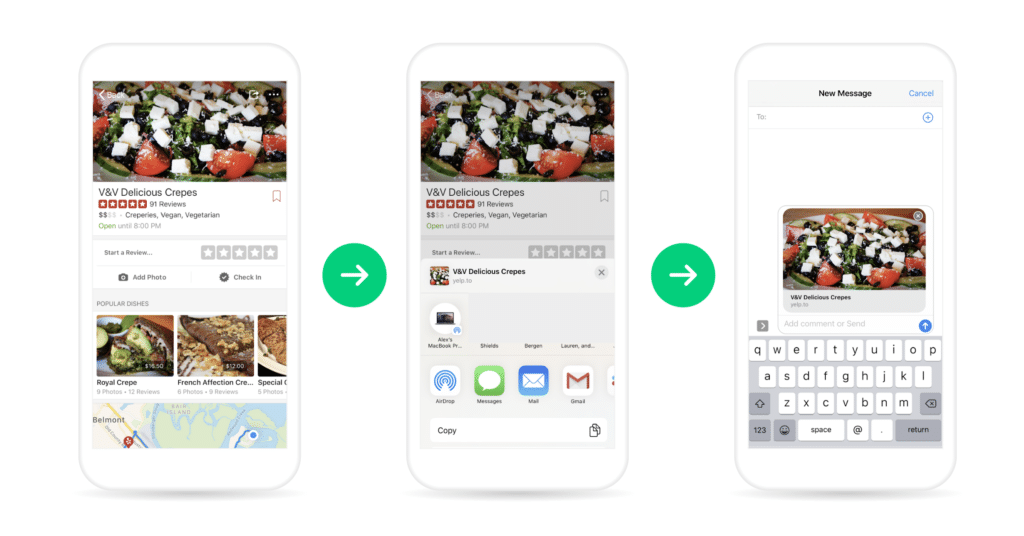
Now your referring user has successfully shared. It’s helpful to understand the common platforms for traffic for optimization, so we pulled data on what are the common platforms for referral traffic. It was surprising that by far, a vast majority of sharing traffic is happening in direct messaging, with Clipboard/Pasteboard as the next most common. Social Media is last with a single-digit fraction of referral traffic.
Top 3 Most Common Share Platforms
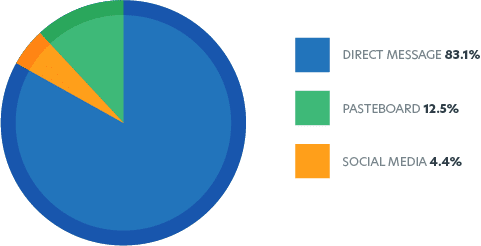
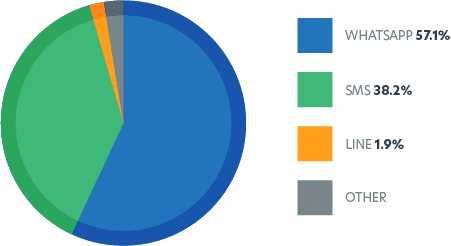
Drilling down on the Direct Message platform, you see that globally, WhatsApp and SMS dominate over 90% of Direct Message traffic.
Expanding Direct Message Platform
A Deep Dive on Referred User Traffic
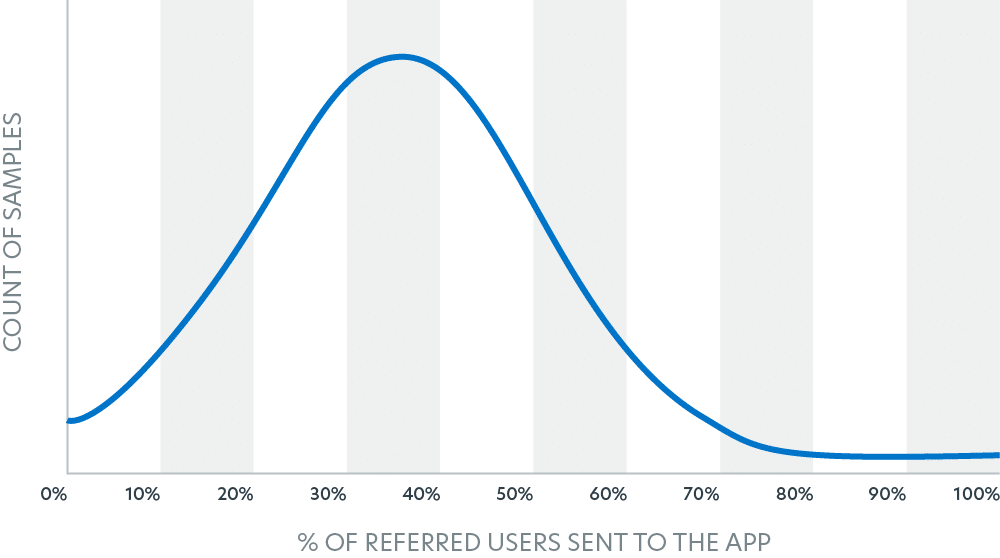
The original user has shared the link with the recipient (likely via direct message) and the referred user is excited to engage. The first surprising finding was that 30-40% of all referring user traffic is being sent directly to a previously downloaded app. This was counter to our previous belief that referrals are primarily a growth channel. This means that a lot of sharing and referral traffic is between existing app users, making it an important re-engagement channel.
Histo. of App Opens from Clicks
Referencing our diagram above, there are two options for configuring sharing links:
- Links that fallback to a website with the intent of engaging users via mobile web
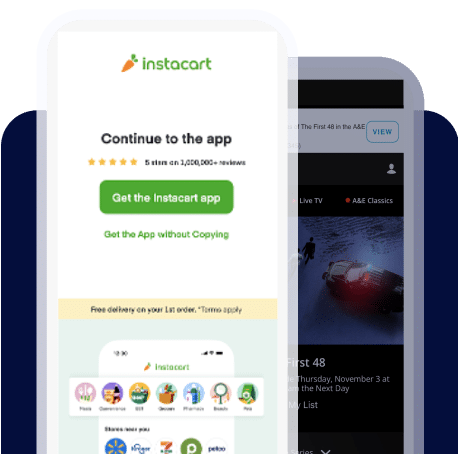
- Links that fallback to the Google Play or iOS App Store to drive an install action
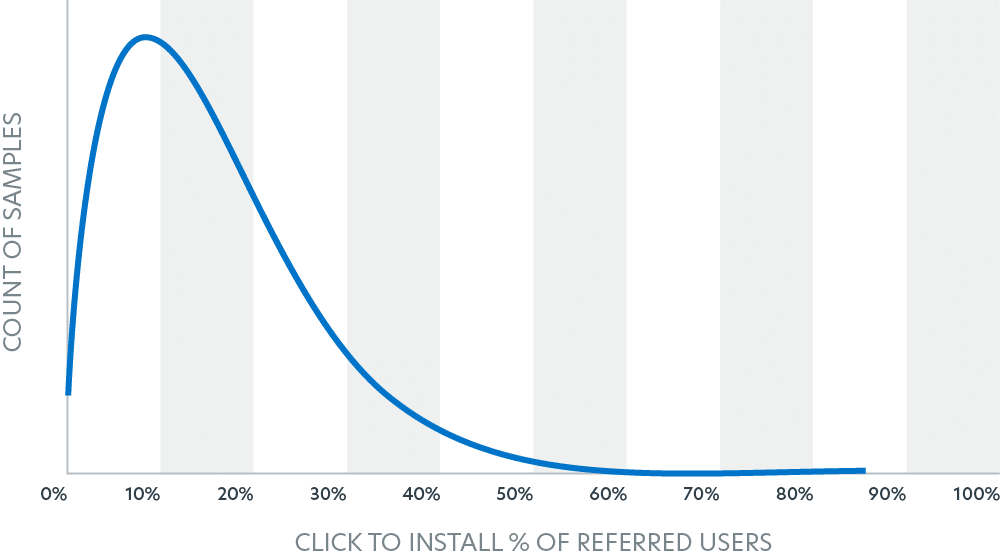
For group 1, all traffic that was not sent to the native app was sent to mobile web. This means that on average, mobile websites would receive 60-70% of traffic if the links are configured this way. For group 2, where a user is being sent to download the app, we pulled the click-to-install percentage. The average of the sample showed ~15% CTI, but you can see that it’s not a normal distribution, showing the peak closer to 8% CTI.
Histo. of Click to Install % for App Fallback Share Links
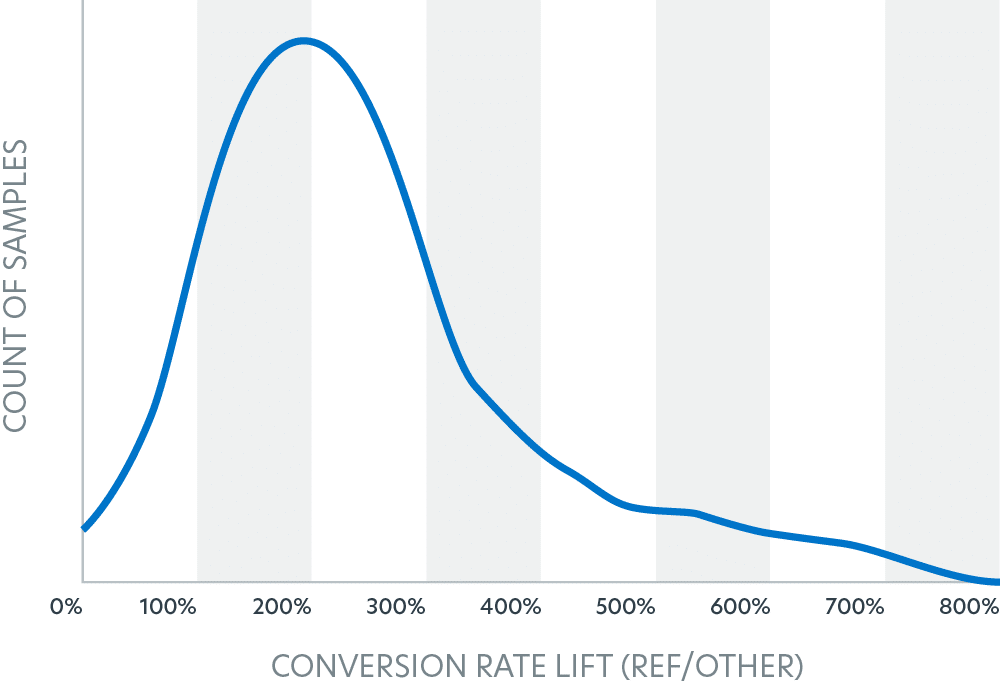
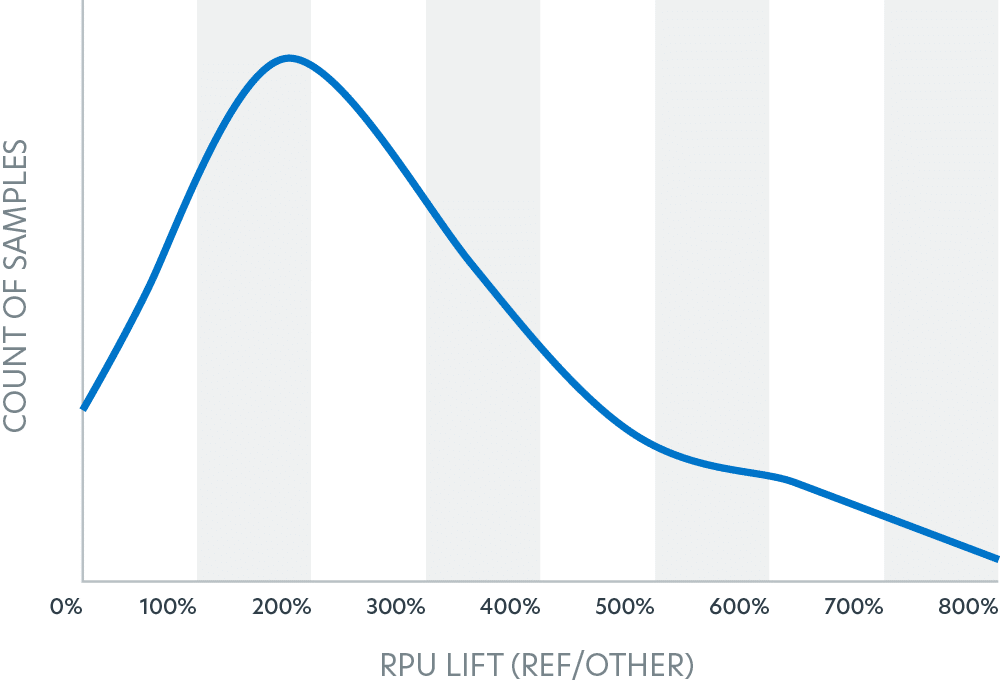
The last and final step in the referred user flow is to “convert”. For our sample, we specifically looked at companies that have a purchase-type event, where there’s a measurable revenue per event. This allowed us to calculate both Conversion Rate and Revenue Per User in both the referral and non-referral cases. It’s possible that these numbers might vary for non-revenue conversion events, but we doubt it’d be substantial.
Rather than show the specific conversion rates, we instead plotted the conversion rate lift of referral traffic as compared with other channels. So, an example for clarity: If the conversion rate of users driven from referrals was 10% and the average conversion rate of users driven from other channels was 5%, then this chart would show 200%. The same math was applied to RPU ($2 RPU for referrals, $1 for other = 200%).
Surprisingly, those that are driven from referrals on average are around 200-300% the conversion rate AND RPU of other channels, with the peaks of the distributions close to 200%. That means that users who are referred by others are, on average, twice as valuable as other channels.
Hist. of Lift on Conversion Rate for Referral vs Other Channels
Histo. of Lift on RPU for Referral vs Other Channels
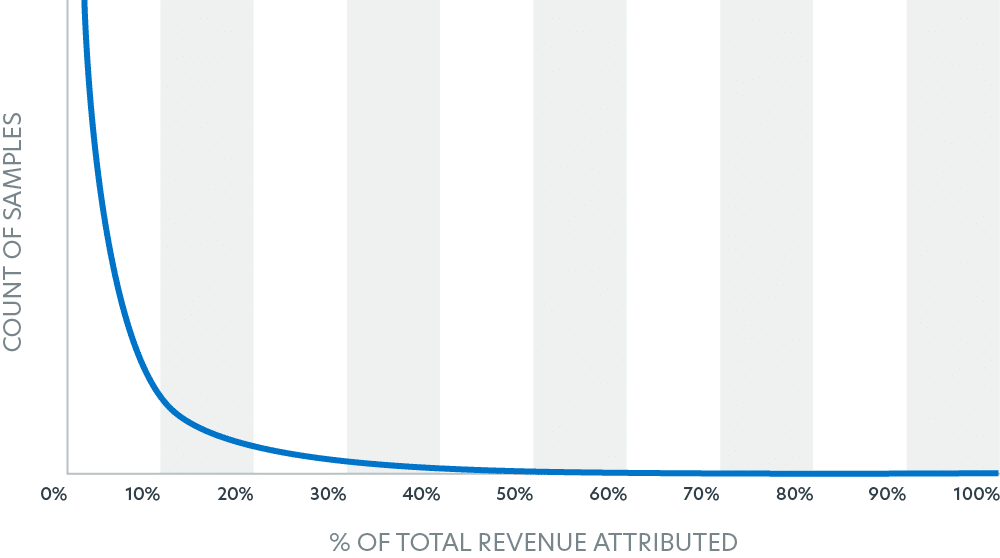
Lastly, for fun, to help benchmark your total traffic that should be driven by referrals, we plotted the distribution of % of revenue that was directly attributed to a referral event. Shockingly, 20% of companies have more than 10% of total revenue directly attributed to referrals.
Histo. of % of Total Revenue Attributed Directly to Referral
To drive growth and re-engagement for your app, learn more about Branch’s deep linked referral programs or contact our sales team to discuss how Branch can help you.