


At Branch, we recently made many exciting improvements to the data and analytics experience within the Branch Dashboard. These include pre-configured export reports, report previews, the ability to view a local currency alongside USD, and a few other notable analytics improvements. The changes are focused on helping improve your user experience and save you time whenever possible.
Now, let’s get into it and explore some of the major updates we made as part of our Branch Dashboard analytics improvements project:
Access pre-configured export reports
One of Branch’s most powerful data export features is Custom Exports, which allows you to specify the exact fields and filters you want to apply to a data export. In the Custom Exports section of the dashboard you can now select from a predefined set of choices that will automatically apply and pre-configure the export settings for the data preferences you select.
Available via both the Branch Dashboard and our API, the Pre-Configured Export solution allows you to export the data that matters most for your analytics needs.
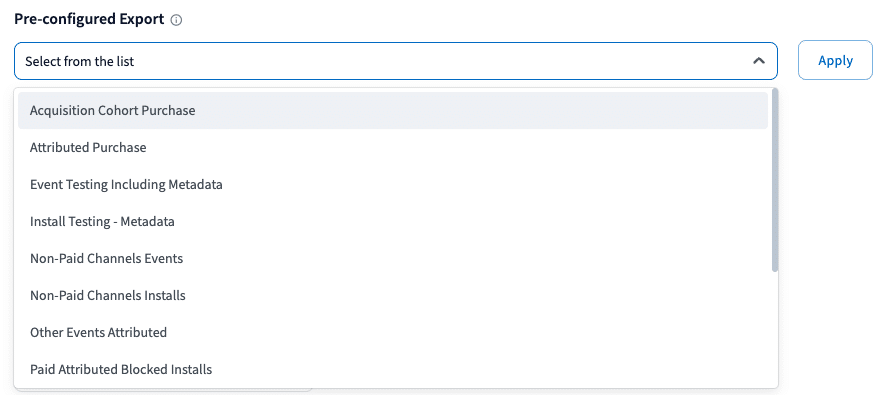
Prior to this improvement, all columns and filters needed to be added manually. This new capability saves time and increases reporting consistency when working with the Custom Exports feature in the Branch Dashboard.
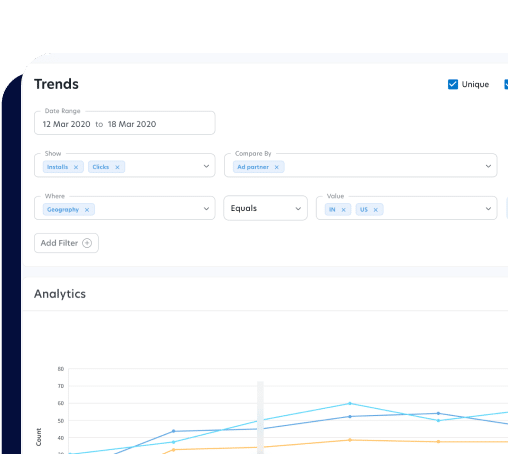
Preview reports before running a full query
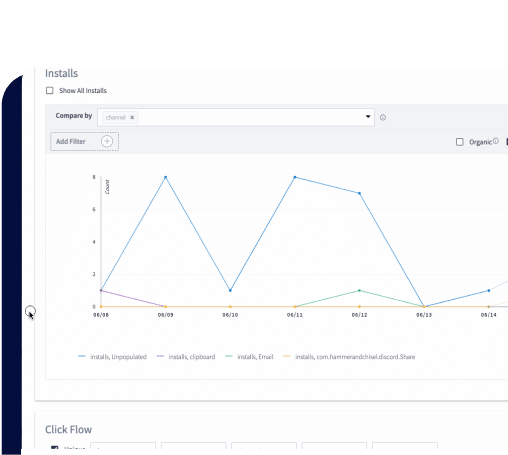
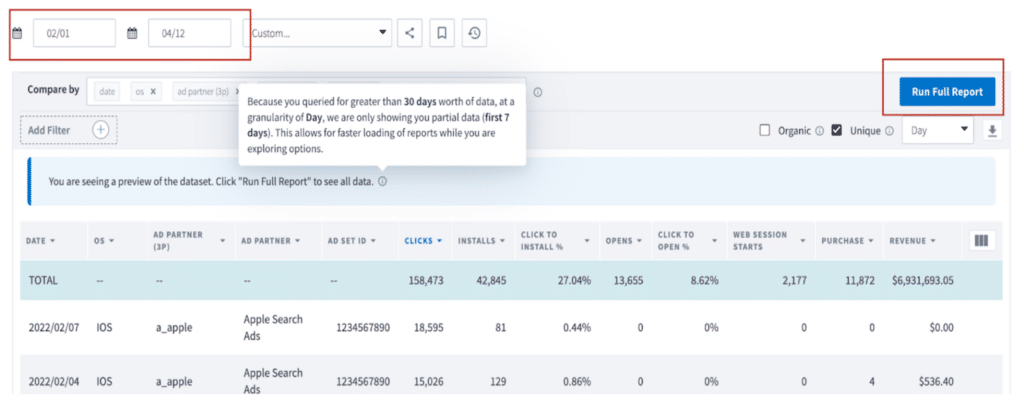
To enable faster report loading while you explore options for viewing data, we’ve added the Report Previews feature to the Branch Dashboard. When you query over thirty days worth of data, a preview of seven days worth of data will be displayed. To run the full query, you can then click the “Run Full Report” button and query the data.
Prior to this change, there was no way to preview a report, so large queries could sometimes create a time out or take a long time to load. This new change improves the overall user experience as well as the efficiency with which you can run reports via the Branch Dashboard.
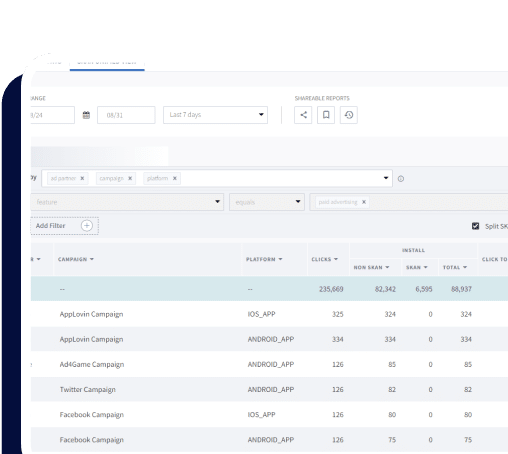
Select events and metrics for reports more easily than ever
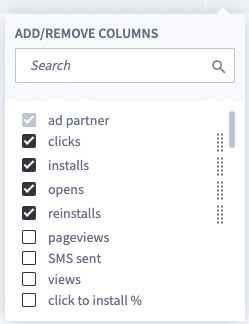
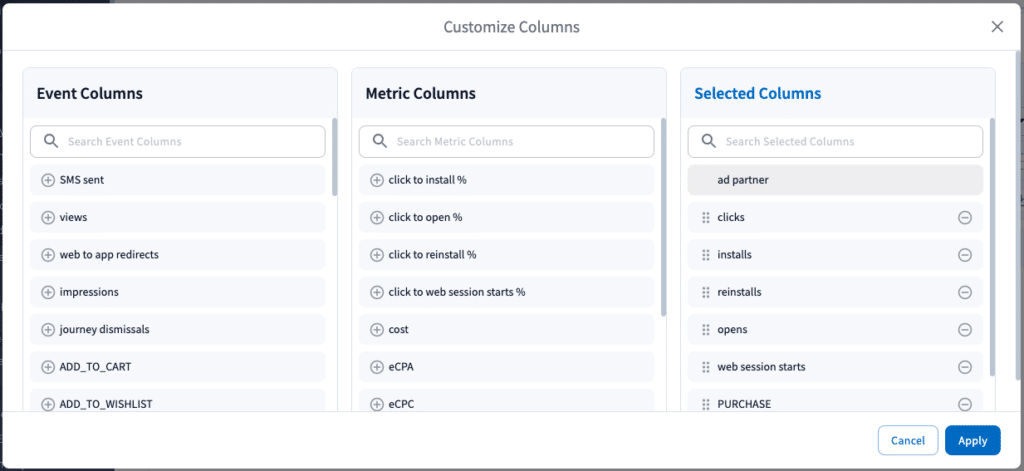
We’ve updated the column selector with a more intuitive and user-friendly interface in the dashboard. The improved customized columns experience features three new sections:
- Event Columns contain the list of events you are tracking in your app, whether they are the commerce, content, or user-lifecycle standard events that Branch provides, or custom events you are tracking via our SDK.
- Metrics Columns include all pre-calculated Branch metrics like click-to-install, click-to-open, and click-to-reinstall rates.
- Selected Columns contain the columns that you have selected from the first two sections.
Note that you can also pin your favorite events and metrics to always appear at the top of these sections.
Before:
After:
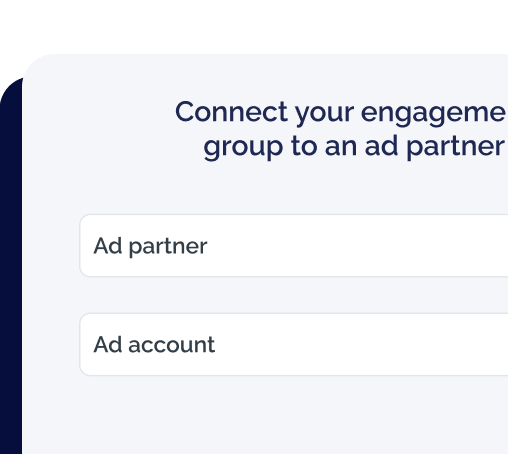
Display revenue and cost data in your local currency
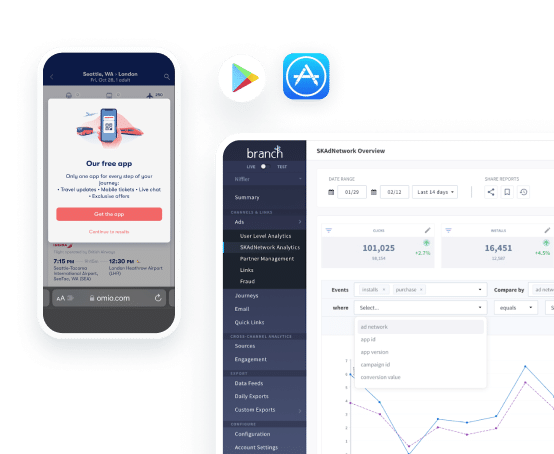
Many of our customers have asked for a way to display local currency alongside US dollars in the Branch Dashboard and in data exports. In response to this, we have added the capability for admins to set one non-USD currency on the dashboard configurations page, allowing you to view cost and revenue data in that currency.
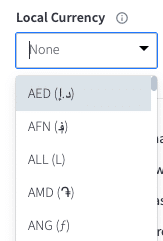
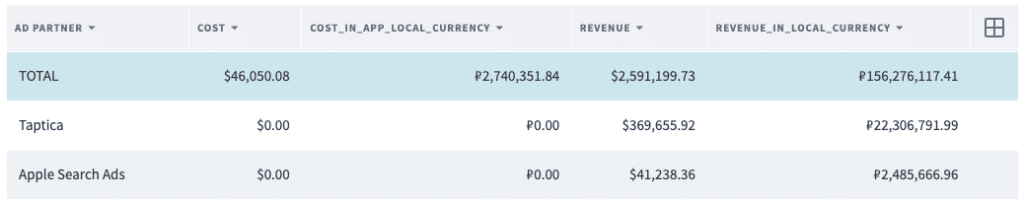
Not only does this new feature simplify workflows and reduce the change for human error, but it also enables you to match the cost and revenue data you see through Branch directly with the campaign data set in your ad network dashboards.
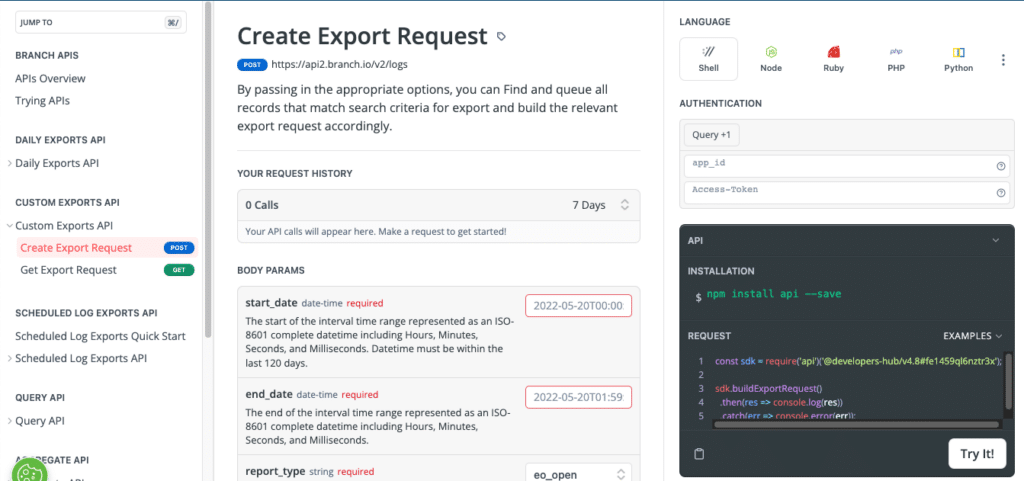
Test Data Export APIs before using them
Alongside all of these exciting enhancements to our analytics features and products, we’ve also updated our Help Center with the capability to query any of our data export API endpoints directly from the relevant help doc page itself. All you need is your App ID, Access Token, and any required request parameters.
The code will dynamically update as you fill in fields and run your API request with the Try It! button, no coding needed! You can even copy the code in your preferred platform and use it in your data pipelining.
Branch is working on even more improvements
Branch is excited about all the updates and changes to our dashboard that will make your job easier and make your data more powerful. We are committed to improving the experience, creating efficiencies, and saving time for our customers.
Stay tuned for even more, coming soon. Explore the latest dashboard improvements here.