


Viral growth. It’s the stuff that app developers’ dreams are made of. Once you find the feature that drives viral growth, you know you’re on a path to success. It’s sustainable and fast growth to your business, delivered at no cost.
At Branch, we don’t have the perfect recipe for viral growth (although we do have some great tips). You can’t just add Branch and expect to grow virally. However, we do give you the toolkit you need to iterate and optimize for it. What are those important tools? There are two critical measurements that you need to solve for virality:
- Virality: You need an overall measure of virality, such as k-factor, so you can monitor the impact on the bottom line of growth.
- Influencers: You need metrics around your most influential, growth-inducing users. You need to know who they are and where they came from, so that you can optimize your marketing efforts for finding more of them.
Outfitting Your App for Measurement
The following section assumes that you’ve properly configured your app with Branch. If you haven’t, first create an account by heading to dashboard.branch.io and signing up, then following the instructions to get set up in our integration guide for your appropriate platform. The Android and iOS SDK’s can even be integrated before someone can finish eating a burrito.
Alias Your Users
After integrating Branch, the first thing to do is to ensure that you alias your users so that you can identify them later in the Branch dashboard. We recommend that you wait to alias your users until you have a distinguishing identifier, such as an email or user ID. This will usually come after the user has registered or logged into your app.
To alias your users in the Branch service, simply callsetIdentityin any of the SDKs. It’s supported across all platforms, but here’s an example on iOS:
Outfit Your Viral Sharing with Branch Links
The second critical piece to outfitting your app for virality and influencers is to ensure that the effectiveness of your viral shares are tracked. SDK-generated Branch links have two critical and essential components:
- Dynamically generated Branch links are automatically associated with the sharing user
- These links attribute new installs back to the original sharing user
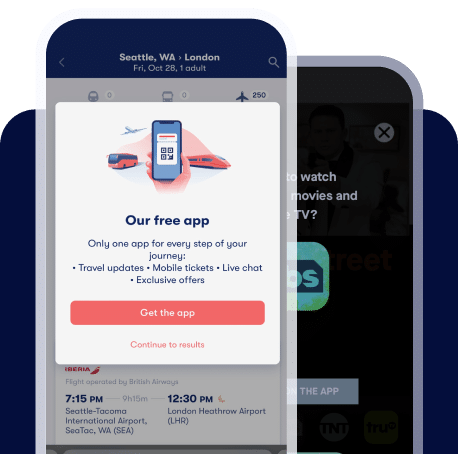
So, how do you get started? Configure the link to be shared using the Branch Universal Object. This is where you define how the link will appear on social media and iMessage, plus add any additional metadata you want to store in the link. It’s supported across all platforms, but this example is using iOS.
Next, there are two common paths depending on whether you have built your own share sheet. If you want to use the Branch share sheet, which automatically tracks the channel the user selects, you can trigger it like so:
If you have your own, custom-built share sheet, it’s easy to drop a Branch link into the message:
Measuring Aggregate Virality of Your App
There are many schools of thought on exactly how to measure the total virality of an app. It honestly doesn’t matter which one you use, but pick a metric and write down exactly how you calculated it. It’s important to consistently check whether you’re improving.
We’d suggest you measure the total number of user-driven referrals to your app over a given time period, divided by the number of active users. For example, if you have 100 active users over a 7 day period, and you track 5 new referred users, your aggregate virality would be 5 / 100 = 0.05 or 5%.
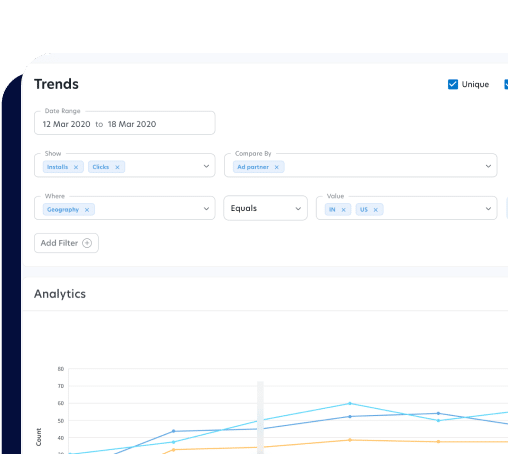
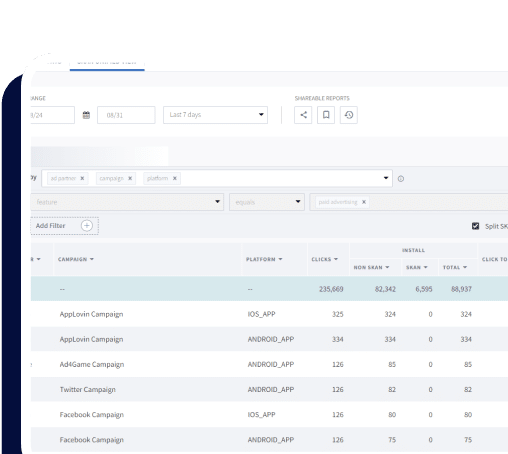
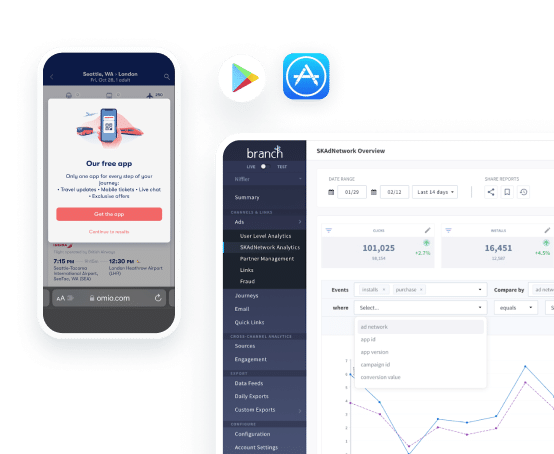
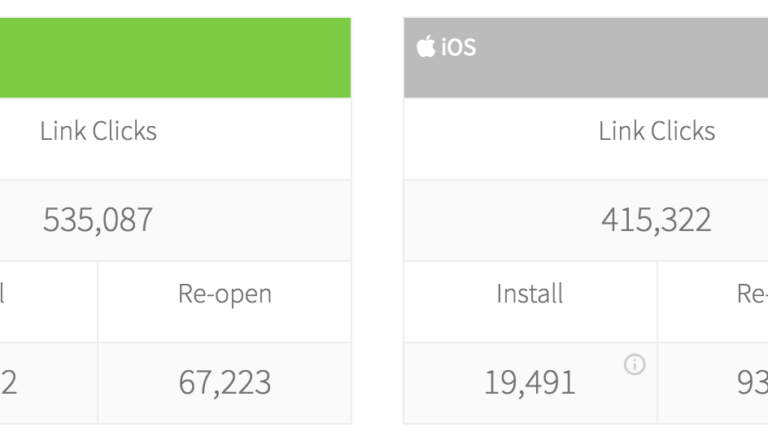
To get the total number of referred new users, simply head to the Branch dashboard, navigate to the summary page, and scroll down to the “Click Flow Analytics” section. You can set the filter to feature = “share”, then look at the total number of new installs driven from this channel across both iOS and Android. Here’s an example:
 In the example above, you’d add the iOS and Android numbers together to get 45,923 total referred installs from the “share” feature.
You can read the total number of active users in a time period from any in-app analytics package, such as Amplitude, Flurry, Mixpanel, etc. If you’re not using any other analytics platform and want to get it from Branch, you can export the raw data about app opens from event export page on the Branch dashboard. If you just sum up the total number of unique Branch identities you see in the export, you’ll get the total number of active users.
Identifying Growth Influencers
Before diving into an explanation of how to identify influencers, let me first give a brief explanation of what an influencer is. I’m not referring to someone in your industry that you pay for traffic or a brand ambassador. I’m referring to regular users that end up driving a significant number of their friends to download and try your app. They do it out of the kindness of their heart, because they love your product and their friends listen to them. In fact, 92 percent of consumers believe recommendations from friends and family over advertising.
You can build features in your product to facilitate influencers to share or make improvements to the experience that causes a burst of sharing. Identifying who these people are and where they came from, will give you the information you need to continue improving the product.
And Branch gives you an entire dashboard where you can monitor your influencers. You simply need to head to the Referrals section of the dashboard. Here, there are two important numbers:
- Summary stats
The summary stats give you a high-level overview of the total number of users who have referred users and the total number of users who have been referred. You can use these metrics to get a quick picture of the “density of referrals.” This will let you know if it’s just a few users who are sharing or if it’s more balanced.
Here’s an example influencer summary stats page:

- Influencer table
If you head to the second tab, labeled “Influencers,” you’ll see the actual table of your influential users with the corresponding count of new referred users. The “User ID” column will include the alias label you set with thesetIdentityin the instructions above. You can even click through and see the table of users who were referred by each influencer.
This can help assist in looking at the referral density, but more importantly, this can help you identify those users who are driving growth, and help you push them to do it more. In the example below, you can see that the top influencer has driven an order of magnitude more referrals than the second best.
 Understanding Influencer Origins

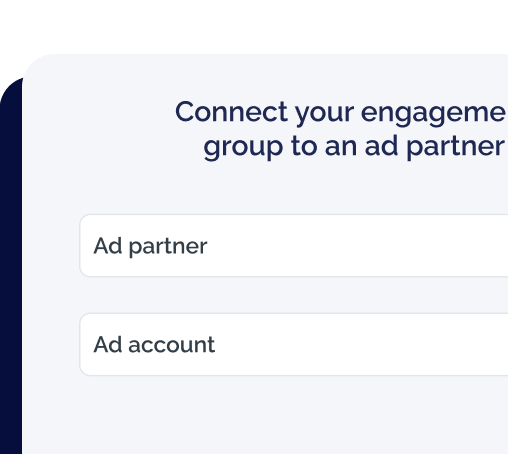
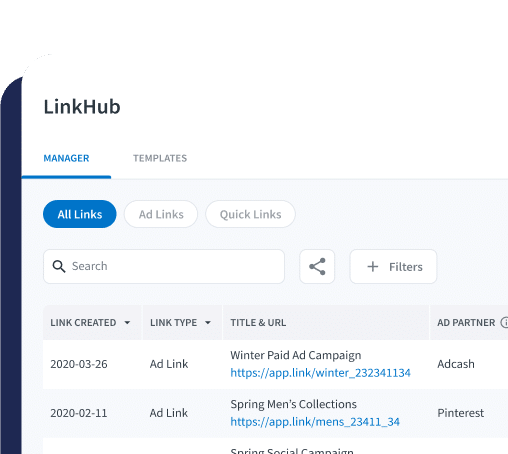
Now that you have a good idea of who your influencers are, it’s important to understand which of your marketing activities are driving users who share. By using Branch quick links, you can track which marketing activities are driving users who share.
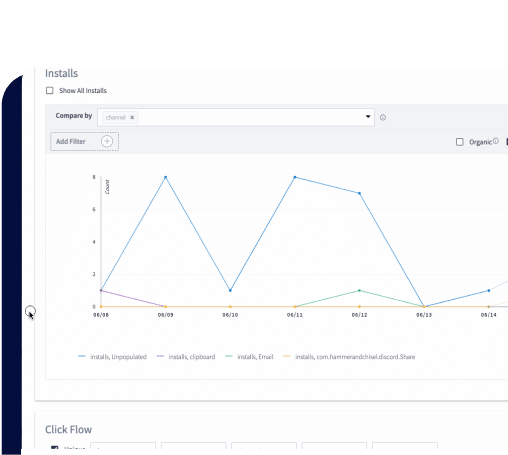
If you’re using the Branch share sheet for your shares — “Share Initiated” and “Share Completed” — are automatically registered as events based on the user behavior of starting and completing a share. Using the source analytics in the Branch dashboard, you can measure the effectiveness of individual marketing campaigns to drive conversion to share. This can help you optimize your efforts to drive the most virality.
Here’s a quick example of the source analytics in action, measuring the conversion from Click -> Share Completed.
 After you get this all set up and start to see the early results. It’s going to look great right away. But don’t give up! Be logical in your next steps and be strategic in your feature development.