


The 2017 Mary Meeker Internet Trends Report is officially live. For those that aren’t aware, Mary Meeker, a partner at Kleiner Perkins Caufield and Byers, has assembled an internet trend industry report since 1995. The original deck contained 25 slides and focused the state of capital markets and updates in the technology industry, which makes sense as Meeker was working at Morgan Stanley at the time. Since joining the VC, the industry report has blossomed with this year’s deck topping 355 slides (the longest in its history) and adds a section on the healthcare industry.
But here at Branch, we take interest in not only internet trends, but specifically mobile. We’ve looked at all 355 slides and found the most pertinent information related to those mobile and internet trends:
General Internet Trends
- Global internet usage rose to 3.4B people in 2016, which is 10% change Y/Y.
- Internet usage (engagement) in the US has a 4% growth rate.
- The average adult spends 3.1 hours on their mobile phone. (Five years ago we spent less than one hour on our mobile phones).
- China mobile internet users are around 700 MM, with 12% growth rate Y/Y. China’s mobile internet usage sees a 30% Y/Y growth which outpaces users. China’s mobile internet users has declined since 2013, but is seeing a positive growth this year of 12% Y/Y.
- India has 355MM users with 27% penetration, which is second behind China.
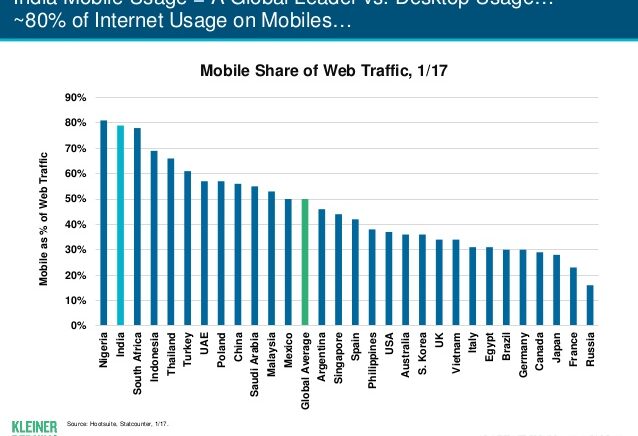
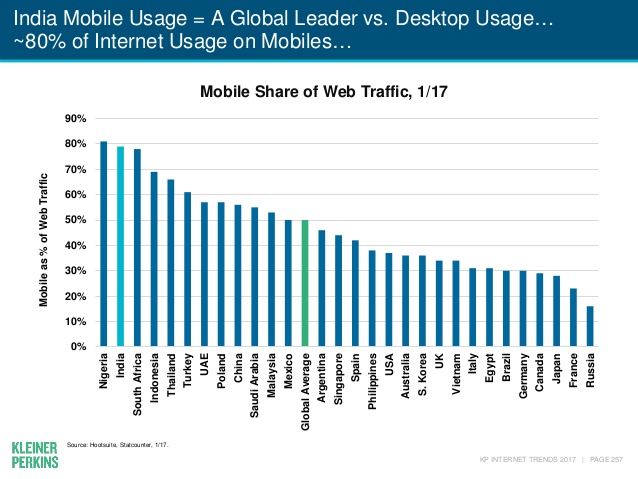
- In India, 80% of internet usage is on mobile.
Here’s the full graph of mobile share of the internet by country:
Android vs. iOS
- India tops the charts with close to 150B hours spent on Android phones and surpassed the US for the most Google Play Store downloads at over 6B in 2016 (data excludes China).
Online Advertising
- Ad growth is being driven by mobile. In 2016, $73B was spent on internet advertising, $37B of that was mobile. In terms of time spent vs. ad spend on mobile, the report sees a $16B opportunity in the USA for mobile advertising.
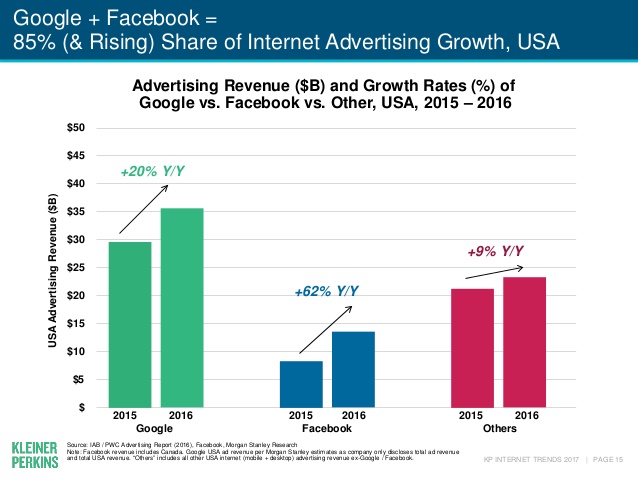
- As you can see, Google and Facebook own 85% of the market for internet advertising. Google has seen 20% Y/Y growth rate while Facebook is booming with a 62% Y/Y growth rate. Facebook is increasingly becoming an important channel to advertise on with their massive amount of user information.
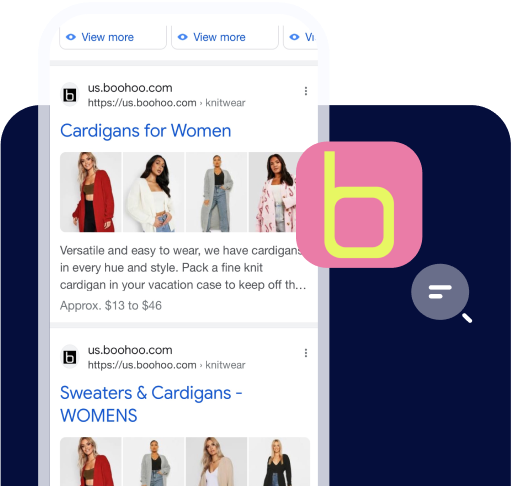
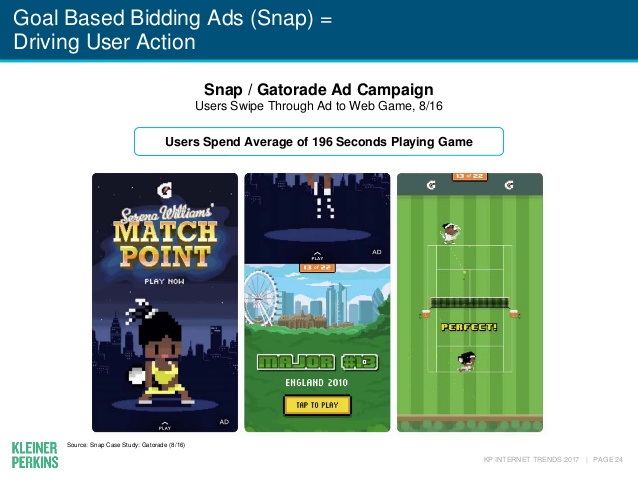
- Product listing ads on Google, Pinterest and Facebook have a positive response and are driving purchases. 52% of retail paid clicks on Google were product listing ads (PLA). Pinterest’s ads have seen 12% increase in buying over the last two years. As well, Facebook saw 26% of users that clicked on an ad made the final purchase. But the newcomer? Snap ads are emerging for many advertisers:
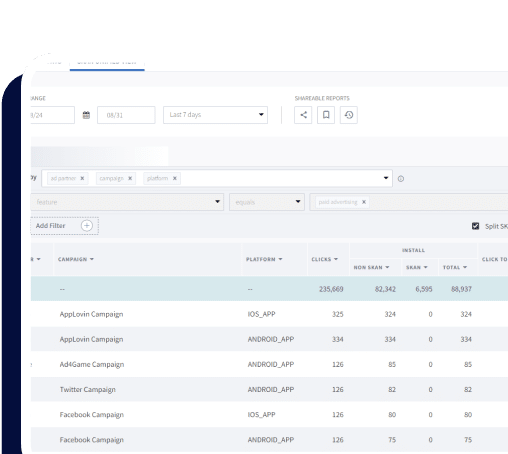
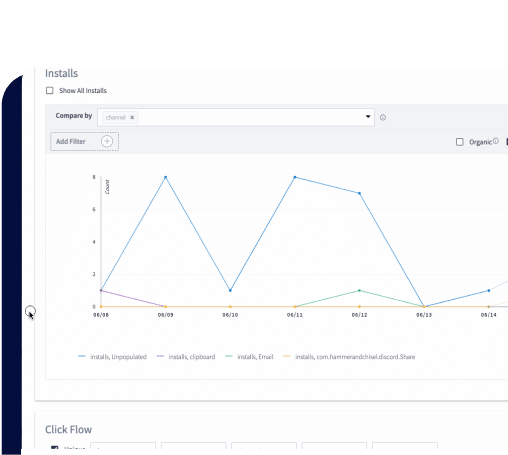
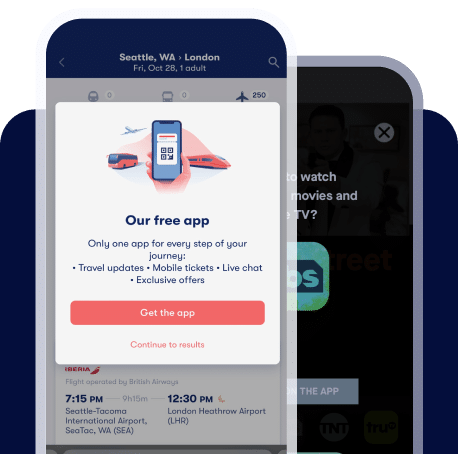
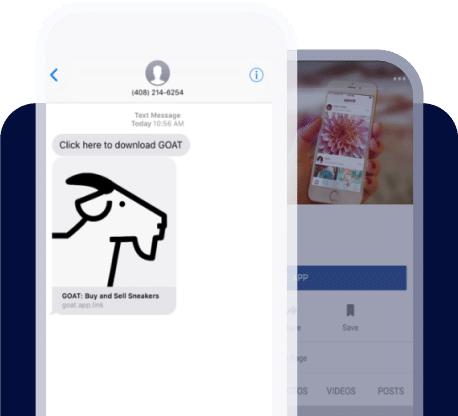
- Specific to mobile apps, in-app ads drive higher install performance rates. Dynamic creative ads from Vungle change ad information based on user, and when using these ads, brands see a conversion rate of about 0.50%.
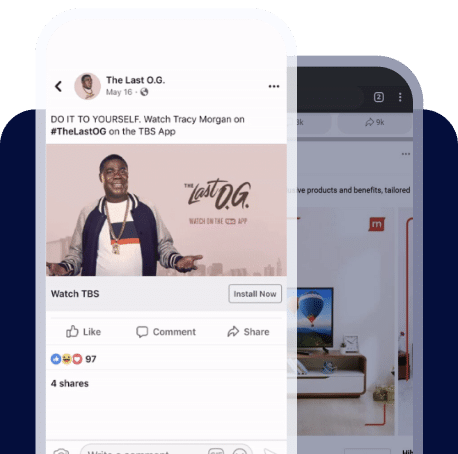
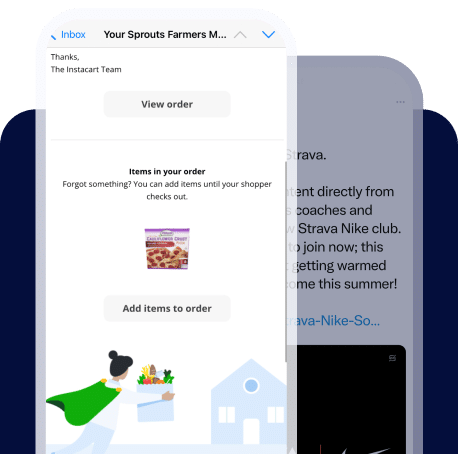
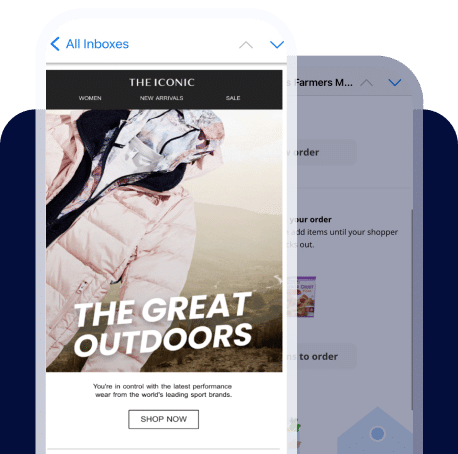
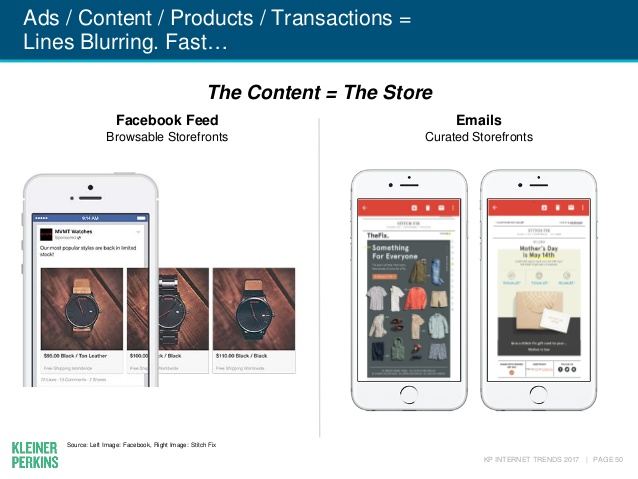
- Additionally, Facebook, Instagram and Snapchat have all incorporated ads to feature some sort of transaction. The boundaries are blurring quickly between featuring content or a product in an ad. Here are examples the report cites from Facebook and Email:
Social
- Big brands have seen better user engagement on social through user generated content. Brands like Qatar, Red Bull and BMW repost user generated content 60%+ of the time.
- According to the report, image-based platforms like Instagram and Snapchat are the future and user generated geo-location images are increasingly popular (Instagram and Snapchat Stories). The report sees typing becoming replaced with tap and augmented features (location stamps, ability to add hashtags to Instagram stories, etc.).
Voice
- Voice is growing at an alarming rate and is continuing to improve. As evidence, Google has achieved a 95% voice recognition accuracy in 2017.
- Google Assistant saw 20% of all mobile queries were made via voice.
- In Q1, Amazon Echo reported 12 million downloads and has 12,000 uses cases.
eCommerce
- eCommerce saw a 15% Y/Y growth rate in 2016:
- San Francisco Bay Area’s top 10 restaurants on Doordash have seen 45% growth rate Y/Y since 2015 and now see 7% of their revenue come from delivery.
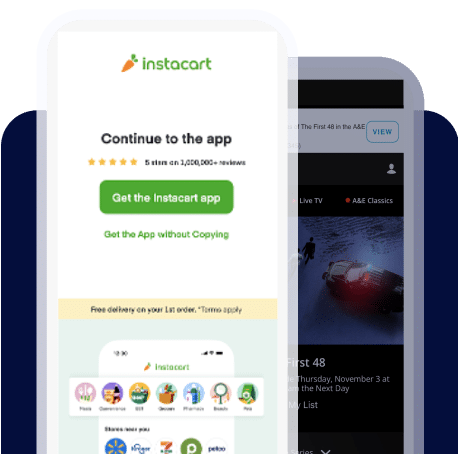
- Instacart sees an 8x increase when users are prompted with a ‘buy it again’ option.
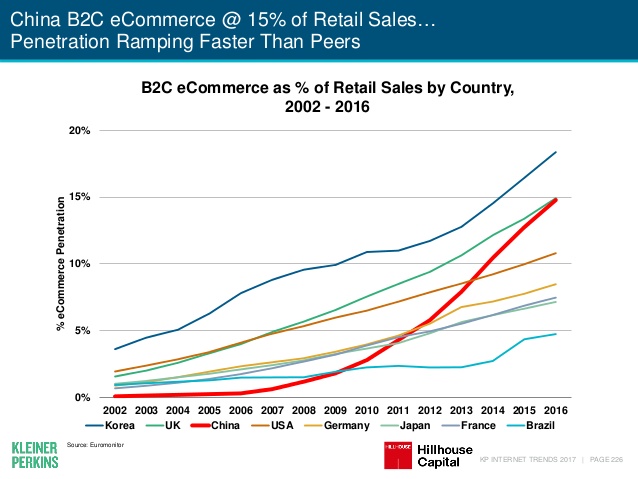
- China mCommerce market is one to keep an eye on. It topped out at $681B gross merchandise volume in 2016 with 71% of those purchases coming from mobile.
Here’s a breakdown of B2C eCommerce by country:
 Video
Video
- Video content still reigns supreme. Facebook is ramping up video content among all its entities (Messenger, Instagram, Facebook and Whatsapp) and saw MAUs totaling 2,000MM in 2016.
- Snap is also seeing an increase of viewers in their original shorts content. The show, Phone Swap, totalled 10MM + viewers in its first episode, while the show, Second Chance, saw 8MM + viewers.
Time Spent on Mobile
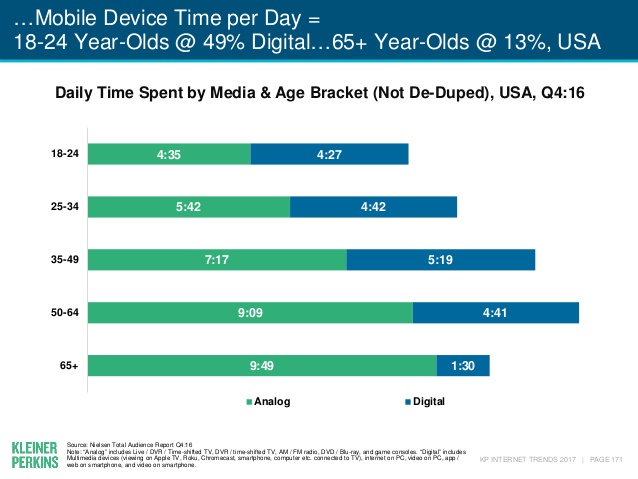
- Digital time spent on device has doubled since 2015, and users are now spending 4 hours and 14 minutes a day on their mobile device.
- When broken down by age, 18-24 year olds spend 49% of their time per day on their mobile device. The other half is by analog which the report defines as: live / DVR / Time-shifted TV, DVR / time-shifted TV, AM / FM radio, DVD / Blu-ray, and game consoles.
Here is the full breakdown of mobile device time spent by age:
Consistent with the 2016 report, mobile continues to be the driving force of the industry. With more than half of digital media time spent on mobile, it will be ever important for brands to continue to drive and retain users on mobile.